
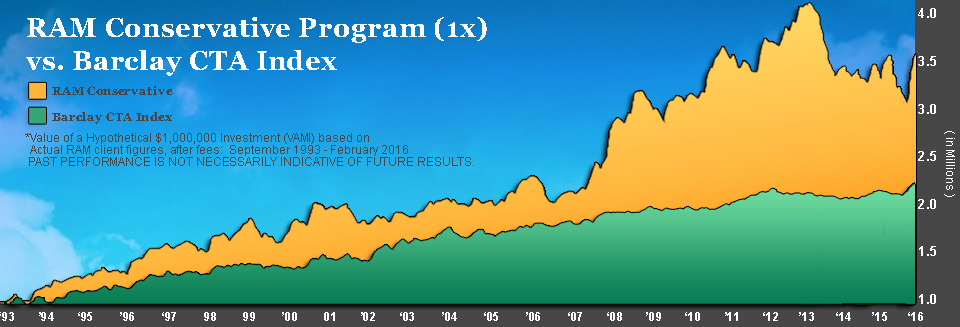
RAM Conservative Outperforms Barlcay CTA Index
Since the programs inception, RAM Conservative has outperformed the Barclay CTA Index over the past 19 years.
PAST PERFORMANCE IS NOT NECESSARILY INDICATIVE OF FUTURE RESULTS.
RAM Conservative Outperforms Barlcay CTA Index
Since the programs inception, RAM Conservative has outperformed the Barclay CTA Index over the past 19 years.
PAST PERFORMANCE IS NOT NECESSARILY INDICATIVE OF FUTURE RESULTS.
RAM Conservative Outperforms Barlcay CTA Index
Since the programs inception, RAM Conservative has outperformed the Barclay CTA Index over the past 19 years.
PAST PERFORMANCE IS NOT NECESSARILY INDICATIVE OF FUTURE RESULTS.
RAM Conservative Outperforms Barlcay CTA Index
Since the programs inception, RAM Conservative has outperformed the Barclay CTA Index over the past 19 years.
PAST PERFORMANCE IS NOT NECESSARILY INDICATIVE OF FUTURE RESULTS.
RAM Conservative Program
Individually Managed Accounts...
RAM Management Group's Conservative Program 1X employs a technical and rules-based trading strategy. The program utilizes multiple components including breakouts, volatility, trend following, and counter-trend following features. These generate entry and exit trade signals. RAM trades less than 30 different commodity, foreign exchange, equity index, and financial based futures contracts. The trading model's objective is to capitalize on the direction of price movement experienced in a wide range of futures markets. RAM uses various proprietary technical, statistical, and pattern recognition analysis to identify potential profit opportunities.
The key to RAM's past success in providing consistent returns, which have been non-correlating to highly followed equity indices, has been its ability to manage risk. RAM manages risk with the objective of limiting losses, diversifying positions, and preserving capital.
RAM was formally designed by Mr. Robert A. Moss between January 1992 and July 1993 and is based on over 30 years of direct market observations, both on the exchange floor and off. The trading model was further developed with the assistance from a mathematician from Cornell University, who had acquired extensive experience in statistical inference and pattern recognition during employment in the defense analysis industry. The Advisor's technical trading system is designed to forecast and take advantage of trends and counter-trends in futures prices. At the same time, RAM suppresses risk by limiting duplications of positions in closely related markets, by restricting the initiation of positions in which the Advisor feels the likelihood of a profit is higher than normal, and by trading in many different futures markets.
RAM Conservative Program: Fees & Performance
| Account & Fees | RAM Conservative | Barclay CTA Index | S & P 500 Index | |||
| Style | Managed Futures | 1993 | 9% | N/A | 7% | |
| Type | Managed Account | 1994 | 12% | -1% | -2% | |
| Minimum Investment | $ 1 Million | 1995 | 11% | 14% | 34% | |
| Trading Level Incremental Increase | $ 1 Million (Fixed) | 1996 | 7% | 9% | 20% | |
| Management Fee | 1% | 1997 | 11% | 11% | 31% | |
| Performance Fee | 20% | 1998 | 4% | 7% | 27% | |
| Average Commission | $7.00 | 1999 | -1% | -1% | 20% | |
| Available to US Investors | Yes | 2000 | 13% | 8% | -10% | |
| Subscriptions | 2001 | 3% | 1% | -20% | ||
| High Water Mark | Yes | 2002 | 1% | 12% | -23% | |
| Subscription Frequency | 2 Days | 2003 | 6% | 9% | 26% | |
| Redemption Frequency | 2 Days | 2004 | -1% | 3% | 9% | |
| Investor Requirements | Accredited Investor | 2005 | 12% | 2% | 3% | |
| Lock-up Period | None | 2006 | -6% | 4% | 14% | |
| Trading | 2007 | 17% | 8% | 4% | ||
| Trading Frequency | 1,000 RT/YR/$1M | 2008 | 23% | 14% | -38% | |
| Avg Margin-to-Equity | 5% | 2009 | 3% | 0% | 23% | |
| Worst Peak-to-Trough | -23% | 2010 | 12% | 6% | 13% | |
| Sector Focus | Diversified | 2011 | 3% | -3% | -0% | |
| Sector Style | Short to Medium Term | 2012 | 9% | -2% | 13% | |
| 2013 | -13% | -1% | 29% | |||
| 2014 | -5% | 8% | 11% | |||
| 2015 | -5% | -1% | -1% | |||
| 2016 YTD | 7% | 2% | -5% | |||
| TOTAL | +235% | +188% | +317% | |||
PAST PERFORMANCE IS NOT NECESSARILY INDICATIVE OF FUTURE RESULTS. THE RISK OF LOSS IN TRADING COMMODITY INTERESTS CAN BE SUBSTANTIAL.
Monthly Returns
| Year | Jan | Feb | Mar | Apr | May | Jun | Jul | Aug | Sep | Oct | Nov | Dec | YTD |
| 2016 | 2.55 | 4.10 | 6.80 | ||||||||||
| 2015 | 6.33 | -1.05 | -5.10 | 0.35 | 0.76 | -1.24 | -2.94 | 2.86 | -2.15 | -1.79 | 1.65 | -2.16 | -4.90 |
| 2014 | -1.59 | -1.57 | 0.09 | -0.51 | -0.89 | -0.12 | 1.86 | -0.61 | -2.84 | -0.34 | 3.68 | -1.81 | -4.70 |
| 2013 | -3.16 | -3.66 | -0.41 | -2.26 | -1.96 | -1.97 | -1.82 | 1.21 | 1.39 | -2.30 | -0.80 | 2.24 | -12.90 |
| 2012 | -0.90 | 2.13 | 3.31 | -1.97 | 3.67 | -0.53 | 4.47 | -0.18 | 1.25 | 0.23 | -1.91 | -0.93 | 8.70 |
| 2011 | -4.47 | 0.46 | 2.36 | -0.70 | -2.28 | -0.23 | 0.08 | 6.68 | 3.31 | -1.06 | 0.00 | -0.47 | 3.30 |
| 2010 | -1.01 | -1.38 | 3.11 | -1.10 | 8.83 | -1.57 | 4.05 | 1.12 | 2.17 | -1.73 | -1.99 | 1.37 | 11.93 |
| 2009 | -2.81 | 0.56 | -1.77 | -2.85 | 6.61 | 0.87 | 0.12 | 2.03 | -0.44 | -2.67 | 2.52 | 1.11 | 2.91 |
| 2008 | 11.10 | 3.00 | 1.48 | -0.20 | -2.95 | 4.87 | -0.42 | 7.97 | -0.07 | 0.26 | -2.24 | -1.28 | 22.62 |
| 2007 | 0.20 | 1.40 | -2.93 | 1.80 | 2.30 | -1.90 | 4.60 | 4.50 | 4.90 | -4.90 | 4.20 | 2.50 | 17.35 |
| 2006 | -0.73 | 2.07 | -0.25 | -0.23 | -1.67 | -7.24 | -2.71 | 0.21 | -1.71 | 2.90 | 2.20 | 1.20 | -6.20 |
| 2005 | -0.56 | 1.90 | -0.50 | -2.90 | 1.48 | 1.92 | -0.94 | 4.73 | 0.62 | -1.12 | 4.27 | 2.77 | 11.84 |
| 2004 | -0.05 | 0.74 | 0.69 | -2.18 | 2.15 | -4.55 | 3.78 | -1.90 | -1.37 | 1.28 | 4.45 | -3.48 | -0.86 |
| 2003 | -0.21 | -0.13 | -1.02 | -1.07 | -0.53 | 0.61 | 3.80 | -0.89 | 2.40 | 3.20 | -2.35 | 2.22 | 5.98 |
| 2002 | -3.57 | -2.15 | 4.01 | -3.72 | 0.52 | 1.91 | 3.56 | -3.00 | 2.10 | -3.75 | 1.08 | 4.86 | 1.28 |
| 2001 | 8.58 | -1.04 | -0.09 | -2.88 | 0.48 | 1.37 | -1.30 | -0.02 | 3.02 | 0.06 | -2.51 | -2.03 | 3.18 |
| 2000 | -0.01 | -3.48 | 0.04 | 0.37 | 4.65 | 2.28 | 5.76 | 1.30 | -1.80 | 0.02 | -2.40 | 5.97 | 12.89 |
| 1999 | -3.84 | 5.49 | 2.29 | 0.04 | 3.53 | 0.93 | 3.25 | -5.14 | -2.34 | -5.29 | 3.03 | -2.37 | -1.16 |
| 1998 | 0.49 | -1.26 | -1.19 | -4.55 | 2.66 | -2.73 | 0.72 | 9.14 | 3.53 | -2.62 | 2.28 | -2.21 | 3.58 |
| 1997 | 2.32 | 4.26 | 0.83 | -0.75 | 0.44 | 0.72 | 2.25 | -2.32 | -1.25 | 1.96 | 0.53 | 1.98 | 11.34 |
| 1996 | 1.09 | -3.37 | -1.85 | 5.44 | -2.80 | -1.94 | 0.92 | -3.13 | 11.08 | 1.66 | 1.08 | -0.90 | 6.55 |
| 1995 | -1.08 | 1.07 | 2.73 | 1.83 | -1.19 | 0.50 | -1.75 | 1.53 | 3.30 | -3.09 | 4.72 | 2.10 | 10.89 |
| 1994 | -6.15 | -4.34 | -0.05 | -2.13 | 12.99 | 5.28 | -0.27 | 1.28 | 2.28 | -2.67 | 7.07 | -0.62 | 11.77 |
| 1993 | -0.55 | 2.64 | 2.07 | 4.68 | 9.06 |
PAST PERFORMANCE IS NOT NECESSARILY INDICATIVE OF FUTURE RESULTS. THE RISK OF LOSS IN TRADING COMMODITY INTERESTS CAN BE SUBSTANTIAL.